
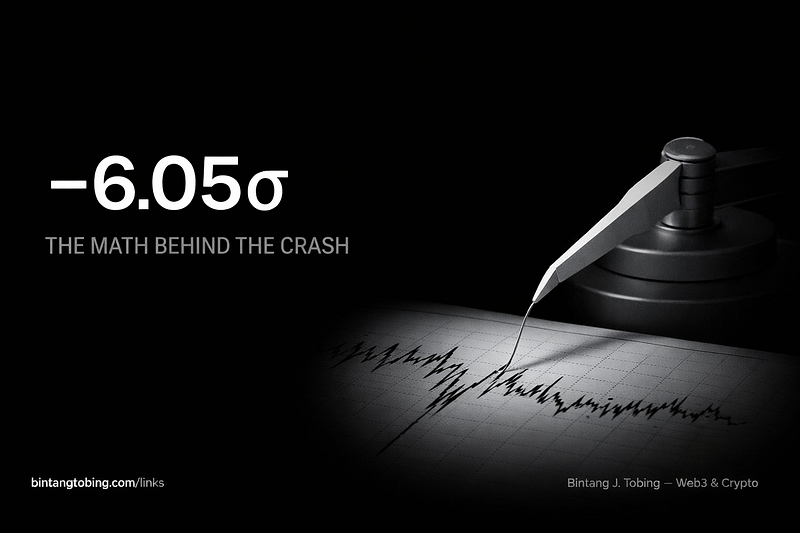
Bitcoin’s −6.05σ
VanEck says February 5 was statistically unprecedented. Woo says the bear is strengthening. And a 16-year dataset proves the bottom doesn’t…
Bitcoin’s −6.05σ Crash, Willy Woo’s Volatility Signal, and the $100-to-$3.3B Paradox: A Quantitative Look at What This Bear Market Is Actually Telling Us
VanEck says February 5 was statistically unprecedented. Woo says the bear is strengthening. And a 16-year dataset proves the bottom doesn’t matter—execution does. Here’s the math.
Affiliate Disclosure: This article contains referral links. I may earn a commission if you sign up through the links below. All data, analysis, and opinions are my own.
I want to talk about numbers today. Not opinions, not narratives—numbers.
Bitcoin is trading at $67,341. The price of Bitcoin has dropped 47% from its all-time high of $126,198 in October 2025. That decline alone isn’t remarkable—Bitcoin has experienced five drawdowns exceeding 50% in its history. What’s remarkable is the statistical signature of how we got here, what the on-chain data is saying about what comes next, and what 16 years of return data reveals about the only variable that actually determines outcomes.
The Statistical Anomaly: February 5, 2026
VanEck published a detailed quantitative analysis of the February crash (https://www.vaneck.com/us/en/blogs/digital-assets/matthew-sigel-what-triggered-bitcoins-major-selloff-in-february-2026/) that should be required reading for anyone trading this market.
On February 5, Bitcoin registered a −6.05σ move on the rate-of-change Z-score. To put that in context: a -3σ move occurs roughly 0.3% of the time in a normal distribution. A −6σ event is, statistically, a once-in-a-billion occurrence under Gaussian assumptions. Obviously, crypto isn’t Gaussian—fat tails are the norm. But even within Bitcoin’s own distribution, February 5 ranks among the 15 fastest crashes in the asset’s entire history.
More striking: Bitcoin is currently trading −2.88σ below its 200-day moving average. VanEck notes that 0.0% of observations over the past 10 years have been further below the 200-day MA. Not during COVID. Not during the FTX collapse. The same was true during the 2022 bear market. Zero per cent.
BTC futures open interest fell from roughly $61 billion to $49 billion over a few sessions—a 20%+ decline in notional exposure. During the week, liquidations totalled over $3 to $4 billion, with an estimated $2 to $2.5 billion concentrated in Bitcoin futures alone.
VanEck’s conclusion is worth noting: "Multiple signals are aligning… the evidence increasingly supports the formation of a localised bottom.” They describe this as “deleveraging without capitulation”—leverage has been meaningfully reduced while price action remained orderly rather than disorderly.
The Volatility Signal: Woo’s Quantitative Framework
Now layer on Willy Woo’s analysis from today. As covered by The Crypto Times (https://www.cryptotimes.io/2026/02/18/analyst-willy-woo-says-bitcoin-bear-market-is-gaining-strength/), Woo is tracking volatility as a trend-detection metric—a methodology used by quantitative trading desks, not retail chart readers.
His argument is structural: Bitcoin entered its bear market when volatility spiked quickly. Volatility has continued to climb, which means the bear trend is strengthening rather than mean-reverting. Woo states that bear markets weaken when volatility peaks and begins declining—"that's when the bear trend starts to weaken.” We haven’t reached that peak.
Woo’s three-phase model adds a macro dimension:
Phase 1 (current, ending): Bitcoin-specific liquidity breakdown. Smart money leads the exit. On-chain capital flows are negative. Permabulls substitute narrative for evidence.
Phase 2 (approaching): Global equities join the decline. Given the scale of equity markets, this phase is slower but deeper. All risk assets correlate downward.
Phase 3 (eventual): Outflows peak and stabilize. Fresh liquidity returns. Capitulation occurs. The actual bottom forms.
This framework is consistent with Bloomberg Intelligence strategist Mike McGlone’s analysis on CoinDesk (https://www.coindesk.com/markets/2026/02/16/bitcoin-s-slide-may-signal-broader-market-trouble-and-a-u-s-recession-mike-mcglone-says), where he identifies a potential "normal reversion" level of 5,600 on the S&P 500, corresponding to roughly $56,000 for Bitcoin under his scaling. His more extreme scenario — Bitcoin reverting toward $10,000 — is contingent on a full equity market peak, which market analyst Jason Fernandes called "false equivalence and single-path bias."
CNBC’s reporting (https://www.cnbc.com/2026/02/11/bitcoin-price-today-crypto-volatility.html) adds that Canary Capital CEO Steven McClurg expects BTC to fall as low as $50,000 by summer, while noting that Bitcoin's four-year halving cycle remains intact — this drawdown is consistent with the historical cooling pattern 12-18 months after a halving event.
The consensus range from CryptoTicker (https://cryptoticker.io/en/bitcoin-price-prediction-february-2026/) for the remainder of February: $64,000 to $75,000, with less than 10% probability of reclaiming $100K before month-end.
The 16-Year Dataset: What $100 Actually Proves
Now the other data point. The viral calculation showing $100 invested in Bitcoin in 2010 — at approximately $0.003 per BTC — is worth $2.2 to $3.3 billion today at $67,300.
Bankrate’s analysis (https://www.bankrate.com/investing/bitcoin-investment-worth-now/) confirms: $1,000 in Bitcoin in 2010 would be worth approximately $1.62 billion today. The Motley Fool (https://www.fool.com/investing/2021/11/16/invested-100-in-bitcoin-in-july-2010-how-much-now/) documented an equivalent gain of nearly 8,000,000,000% from a July 2010 entry.
But the number that matters isn’t the return — it’s the drawdown profile that return was achieved through.
Here are Bitcoin’s peak-to-trough drawdowns since 2010:
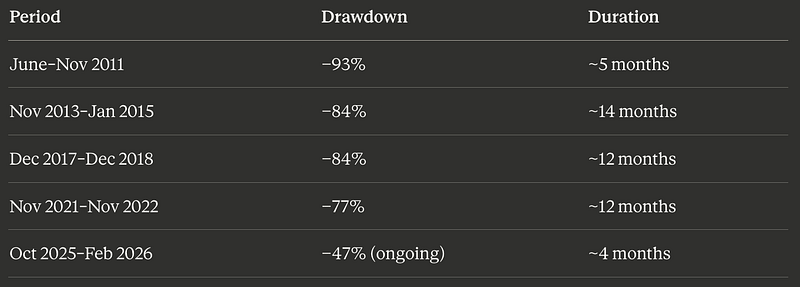
Each of these drawdowns triggered widespread “Bitcoin is dead” narratives. Every single one was followed by new all-time highs. And every single one punished traders who tried to time the bottom more than traders who maintained risk-managed exposure throughout.
The mathematical insight: the annualized return of Bitcoin over 16 years is approximately 150%+ CAGR. But the maximum drawdown required to capture that return was −93%. The Sharpe ratio of a buy-and-hold strategy looks attractive in hindsight—in real time, the volatility was punishing enough to shake out 99%+ of participants.
This is where the analysis converges: the bottom’s exact location matters less than your ability to maintain exposure, manage risk, and execute trades through the drawdown.
The Overlooked Variable: Execution Infrastructure
Let me get specific about what “execution infrastructure” means in quantitative terms, because this is where most analysis stops and most losses begin.
During the February 5 crash, CoinDesk reported (https://www.coindesk.com/markets/2026/02/05/bitcoin-drops-below-usd65-000-heading-to-worst-one-day-drawdown-since-ftx-blowup) that the market experienced "very thin liquidity" and that "even modest sell-offs can trigger a large price reaction, in turn triggering further liquidations." Multiple platforms experienced API throttling, withdrawal delays, and order book instability.
For a quantitative trader, the exchange is part of the execution model. Latency, order book depth, stop-loss execution reliability, and uptime during stress events are measurable variables—not marketing copy.
This is why I’ve migrated most of my derivatives trading to Bitunix over the past several months. Let me walk through the specific technical features that matter from an analyst’s perspective:
Matching Engine & Liquidity Architecture: Bitunix operates a millisecond-level matching engine connected to deep liquidity pools, with top-of-book spreads around 0.001% on major pairs according to MEXC’s independent review (https://www.mexc.co/news/330553). Daily volume exceeds $5 billion. They ranked No. 7 by trading volume and No. 10 by open interest on CoinGlass's 2025 annual report—and were flagged as one of the fastest-growing platforms for both YoY and MoM volume growth (https://blog.bitunix.com/en/bitunix-ranked-top-10-open-interest-top-7-volume-coinglass-2025/).
For context on why the delay matters during stress: as Bitunix’s own AMA with Hacken and Fireblocks detailed (https://blog.bitunix.com/en/bitunix-ama-crypto-liquidity-security-execution/), "exchanges can have deep order books, but if the website or app slows down or freezes during a selloff, traders cannot access that liquidity when they need it most." Latency during volatility isn't a performance issue—it's execution risk.
Guaranteed Stop Loss: This feature is critical for managing gap risk—the precise scenario that destroyed leveraged traders on February 5. Regular stop-losses trigger as limit orders at the market price when your trigger level is hit. During liquidation cascades, the market can gap through your trigger by 2–5% before your order fills. Bitunix’s Guaranteed Stop Loss (https://support.bitunix.com/hc/en-us/articles/47271301728537-Guideline-to-Guaranteed-SL) executes at your exact trigger price regardless of slippage. The cost: a small fee charged only if triggered. No trigger = no fee. For anyone running leveraged positions through a −6.05σ event, this is the difference between a managed loss and a liquidation.
Hedge Mode: Simultaneous long and short positions on the same pair. From a quantitative perspective, this is essential for pairs trading strategies, basis trading, and directional hedging. When the VanEck analysis says we’re in a zone of “statistical disconnection from underlying trend dynamics,” you need the ability to express both views simultaneously. Bitunix’s hedge mode operates independently per position, allowing different leverage and margin settings on each leg.
Futures Grid Trading Bot: Bitunix recently launched an automated Futures Grid tool (https://www.crypto-news-flash.com/bitunix-exchange-launches-smart-futures-grid-trading-tool/) that places structured buy/sell orders within a defined price range. In a $64K-$75K consolidation range—which is exactly what analysts project for February—a grid bot captures repeated oscillations without requiring manual intervention. Each account can run up to 200 grid strategies simultaneously, with collateral allocated from the Spot Account to prevent interference with cross-margin futures positions.
HODL (Recurring Buy): For the long-term thesis — the $100-to-billions perspective—Bitunix's HODL feature allows scheduled recurring purchases across BTC, ETH, and other assets. Dollar-cost averaging through a bear market is the mathematical optimisation of the “survive the drawdown” strategy. Rather than trying to time the bottom, you systematically accumulate at whatever prices the market offers.
Bitunix Earn (Dual Investment): During a bear consolidation, idle capital is capital that loses opportunity cost. Bitunix Earn offers dual investment products on BTC/ETH—structured products that let you “buy the dip” at predetermined price levels while earning an APR on the commitment. In a $64K-$75K range-bound market, this product converts idle stablecoin capital into yield-generating exposure with built-in accumulation logic.
Proof of Reserves: Monthly Merkle Tree verification, published on DeFiLlama and CoinGecko, with reserve ratios exceeding 100% for BTC, ETH, and USDT. Hot/cold wallet separation. Multi-signature protection. Fireblocks and Cobo custody. Hacken third-party audits. $42.5 million in insurance through Fireblocks integration, plus a $5 million dedicated insurance fund. In a bear market where exchange solvency becomes a genuine risk factor—as we learned in 2022—verifiable reserves aren’t optional. They’re a prerequisite.
Tax Reporting: Bitunix now supports full transaction history exports for tax compliance, which is relevant to the new IRS Form 1099-DA requirements for the 2026 tax season. CryptoTicker flagged (https://cryptoticker.io/en/bitcoin-price-prediction-february-2026/) that tax season pressures are contributing to the current sell-off—having clean export data simplifies compliance and prevents forced liquidations from tax miscalculation.
Are you trying to get a chance on Bitunix?
The Quantitative Synthesis
Three datasets point to one conclusion:
VanEck’s −6.05σ analysis says we’re in statistically unprecedented territory — but historically, events of this velocity have exhausted panic selling rather than initiating prolonged cascades.
Woo’s volatility model says the bear trend is strengthening, and Phase 2 (equity correlation) hasn’t begun. The bottom isn’t here yet.
16 years of Bitcoin return data says the exact bottom is irrelevant. What matters is whether you maintained risk-managed exposure through the drawdown and had the execution infrastructure to act when opportunity arrived.
The people who turned $100 into billions didn’t have better predictions. They had better infrastructure—exchanges that stayed online, risk tools that worked, and the discipline to accumulate systematically rather than time perfectly.
The math is clear. The infrastructure is the edge.
Disclaimer: This information is not financial advice. Trading digital assets involves significant risk, including total loss of capital. Please conduct your research prior to making investment decisions.
Follow me: bintangtobing.com/links